Weather worth knowing
Data
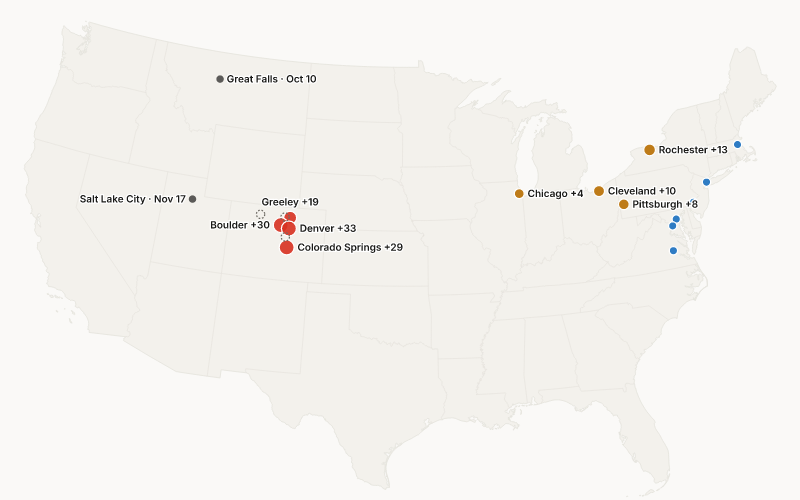
Maps and charts from Anecast's own books: 4 pieces so far, drawn every morning from the tapes and the station records. Each one has a PNG to share and the numbers under it.
Maps and charts from Anecast's own books: 4 pieces so far, drawn every morning from the tapes and the station records. Each one has a PNG to share and the numbers under it.